Master the art of Gantt charts using Excel & MS Project, from the basics to advanced techniques & practical applications
Join us on a journey to Master Gantt charts with our comprehensive course, carefully designed to teach you essential project management skills using Excel and Microsoft Project (MS Project). Broken into two parts, this course guides you through creating and managing Gantt charts step by step.
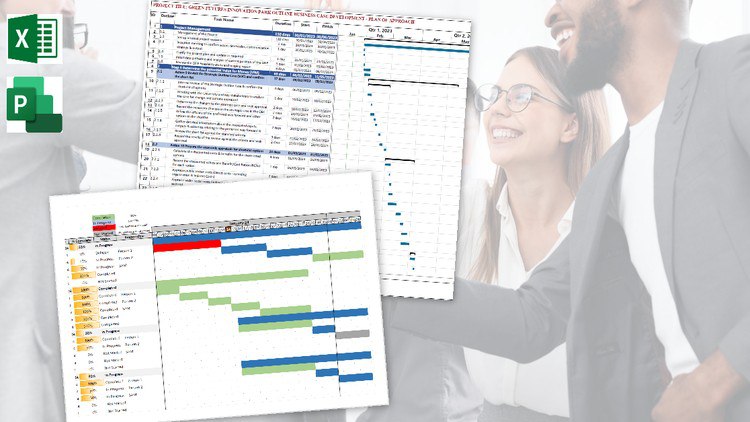
In the first part, you’ll learn how to make Gantt charts in Excel. We’ll start with the basics and move to more advanced techniques, helping you set up workbooks, add project data, and customize charts for clarity.
Moving to the second part, you’ll discover how to use Microsoft Project (MS Project) to create professional Gantt charts. Learn to make the most of its features for tasks like scheduling, resource management, progress tracking, and cost analysis.
But this course isn’t just about chart creation – it’s about mastering the entire project management lifecycle. Learn how to effectively track project progress, manage resources, analyze plan vs. actual performance, and apply professional formatting techniques for clear communication. Through practical examples and real-world scenarios, you’ll emerge ready to tackle any project with confidence and finesse.
Whether you’re a seasoned project manager or just starting out, this course provides the tools, knowledge, and practical insights needed to excel in project management. Join us on this transformative journey and unleash the power of Gantt charts to elevate your project management skills to new heights.
Course Details
- Language: #English
- Students: 637
- Rating: 0 / 5.0
- Reviews: 0
- Category: #Business
- Published: 2024-04-30 20:49:09 UTC
- Price: €44.99
- Instructor: | | Mubasher Rehman – (Master of Engineering – Project Management) | |
- Content: 3.5 total hours
- Articles: 0
- Downloadable Resources: 7
Coupon Details
- Coupon Code: MAY-FIRST24
- Expire Time: 2024-05-05 21:17:00 UTC